Average Pupillary Distance by Gender and Age
6 MIN READ
By Pupillary Distance Team · · Updated
Written by the team that builds the app, not by clinicians — how we research and source these guides.
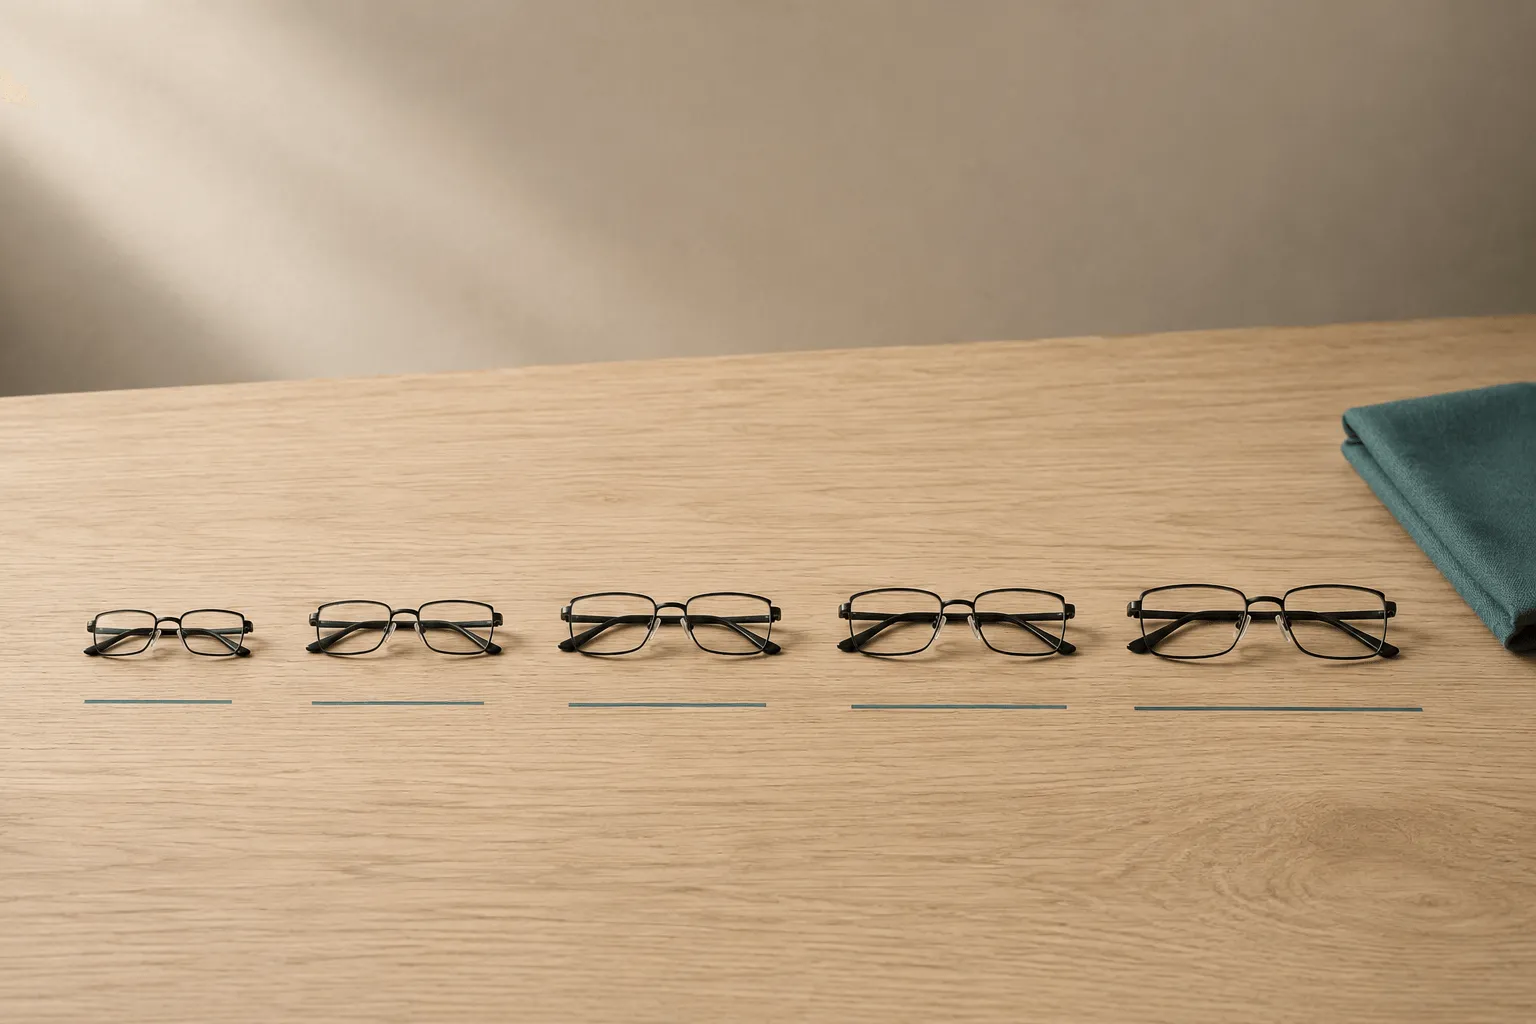
What is the average pupillary distance?
About 63 mm for adults. The most-cited source is the US Army’s ANSUR anthropometric survey, analyzed in Dodgson’s 2004 paper on the variation and extrema of human interpupillary distance: across 3,976 adults the mean was 63.4 mm, with a standard deviation of 3.8 mm. The median and the mode were both 63 mm, which tells you the distribution is close to symmetrical — the average is not being dragged around by outliers.
| Group | People measured | Mean | Standard deviation | Recorded range |
|---|---|---|---|---|
| All adults | 3,976 | 63.4 mm | 3.8 mm | 52–78 mm |
| Women | 2,205 | 62.3 mm | 3.6 mm | 52–76 mm |
| Men | 1,771 | 64.7 mm | 3.7 mm | 52–78 mm |
Those are the numbers. The rest of this page is about what they do and do not tell you about your own face.
How much does pupillary distance differ between men and women?
By about 2 mm on average — and that is less than it sounds.
The gap between the male and female means (64.7 mm against 62.3 mm) is 2.4 mm. The standard deviation within each group is around 3.7 mm. In plain terms: the variation between two randomly chosen women is typically larger than the difference between the average woman and the average man. The ranges overlap almost completely, both starting at 52 mm.
This is why “average PD for women” is a poor way to guess your own number. It narrows the field by a couple of millimeters at most, and a couple of millimeters is exactly the margin that matters when a lens is being centered. Use it as a sanity check on a measurement you have already taken, not as a substitute for taking one.
Average PD for glasses: women vs men
If you are filling in an online order form and want a sanity check on the number you measured, these are the figures to check against. They are rounded from the ANSUR data above; the ranges are the practical brackets most online opticians quote, which line up with the survey once you allow about three standard deviations either side of the mean.
| Who | Average PD for glasses | Usual range | Source |
|---|---|---|---|
| Women | ~62 mm | 54–74 mm (adults) | ANSUR, 2,205 women: mean 62.3 mm (Dodgson 2004) |
| Men | ~64 mm | 54–74 mm (adults) | ANSUR, 1,771 men: mean 64.7 mm (same paper) |
| All adults | ~63 mm | 54–74 mm | ANSUR, 3,976 adults: mean 63.4 mm, SD 3.8 mm |
| Children | grows with age | 43–58 mm | Pediatric norms from a study of 1,311 subjects aged 1 month to 19 years; the bracket is the one retailers’ order forms use |
Two cautions. The women/men split is a 2 mm difference sitting inside a 3.7 mm spread, so it tells you very little about any one face. And a reading a millimeter or two outside these brackets is not a reason to change your number — it is a reason to measure again.
What counts as a normal pupillary distance?
There is no threshold, and nothing to fail.
The vast majority of adults fall between 50 mm and 75 mm. Dodgson’s recommendation for equipment designers who need to accommodate essentially everybody is a wider bracket still — 45 mm to 80 mm — precisely because real people are recorded outside the common range. A PD of 55 mm or 73 mm is uncommon. It is not a problem, and it does not make glasses harder to make.
What that means practically: if your measurement lands somewhere unexpected, the useful question is not “is my face unusual” but “did I measure it properly”. Self-measurement is imprecise enough that a few millimeters of error is ordinary — in one study, people measuring themselves in a mirror repeated to only about 4 mm either way, where a trained examiner with a PD rule repeated to within about 1 mm. An unexpected number is a reason to measure again first.
If you want to place a reading against the distribution in the table above without doing the arithmetic, the PD calculator does it, and converts between far, near and per-eye values at the same time.
Does pupillary distance change with age?
It grows through childhood, then settles.
Children’s PD is smaller than adults’ and increases as the skull grows, which is why a child’s measurement has a shelf life. The reference work here is a study of 1,311 subjects aged one month to 19 years, which established normal values and standard deviations for interpupillary distance across that whole range. For children’s glasses, take the measurement close to when you order and let the dispensing optician do it — the number will not stay accurate for long.
In adults, PD is treated as stable. That is the reason an adult measurement is worth keeping: once you have a reliable number, it carries over to your next pair of glasses even after your prescription changes, because PD describes the geometry of your face rather than the state of your vision.
Why do published averages disagree?
You will find averages ranging from about 60 mm to about 65 mm depending on where you look, and the disagreement is real but not mysterious. Three things explain almost all of it.
Different people. ANSUR measured US Army personnel — thousands of them, but a specific population. Clinical studies typically measure a few dozen people from one local population. A 2021 study of manual and automatic PD measurement reported a mean distance PD of 60.6 mm in its sample; a 2024 comparison of measurement techniques reported 64.2 mm by pupillometer in its own. Both are correct about who they measured.
Far or near. Your eyes converge when you look at something close, so a near PD is roughly 3 mm smaller than a far PD from the same person. A source that does not say which one it reports has already introduced a 3 mm ambiguity — larger than the entire difference between the sexes.
Different instruments. A pupillometer, a hand-held PD rule and a phone app do not produce identical numbers, and a mirror self-measurement is different again. Averages built from different methods are not strictly comparable.
The practical upshot: treat any single published average as a rough landmark, and prefer sources that state their sample size, their method, and whether they measured far or near PD. That is why the table above carries all three.
So what do you do with your own number?
Measure it, rather than infer it from an average. The averages on this page are useful for checking that a reading is plausible and for understanding why the number exists — they are not a way to get one.
If you have not measured yet, our guide to measuring your PD at home covers the ruler-and-mirror method, the friend method and the iPhone method, with the repeatability figures for each so you know what you are getting. The Pupillary Distance app returns far PD, near PD and both monocular values in one measurement, which removes the conversion step entirely.
And as with anything in this area: a PD is a measurement, not a diagnosis. If your vision has changed or correctly made glasses still feel wrong, see an optometrist or ophthalmologist.
Frequently asked questions
Keep reading
Is Pupillary Distance the Same as Axis?
Is pupillary distance the same as axis? No — PD is in millimeters, axis in degrees. Why the two get confused on a prescription, and what a mix-up does.
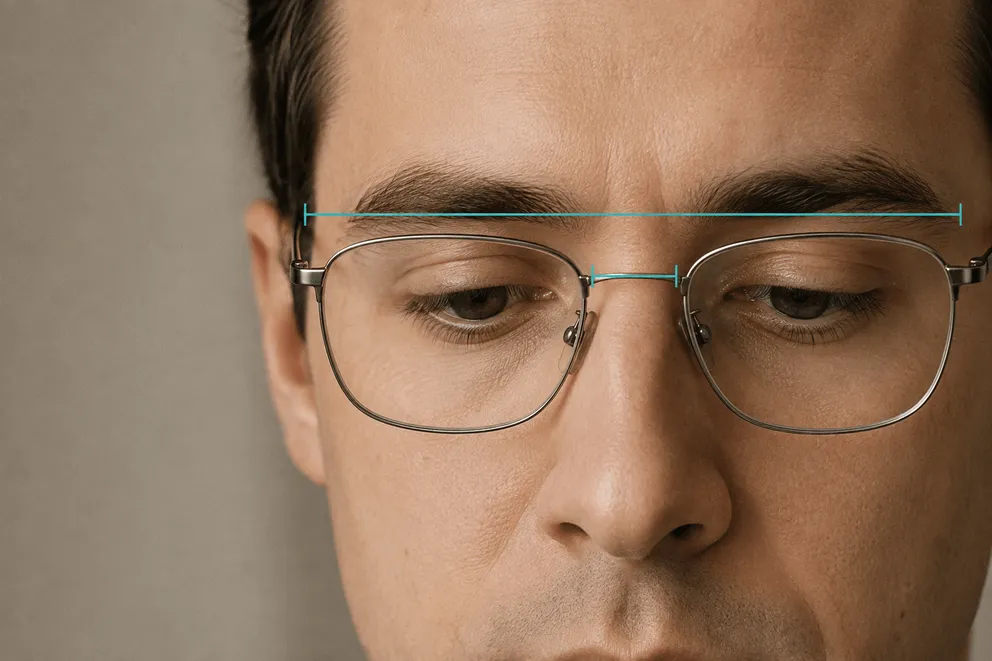
How to Measure Your Face for Glasses (Frame Width, Bridge & Lens Size)
Measure your face for glasses: the three numbers on every frame, taking them from an old pair or your face, which one decides the fit, and where PD fits.
4.4★ · 310+ Reviews
Your PD, measured in under a minute.
Pupillary Distance turns your iPhone into an accurate PD meter. Measure once, then order glasses online with confidence.